Next: The Bohr Atom * Up: The Problems with Classical Previous: The Rutherford Atom * Contents
Hydrogen was ultimately the true test of the quantum theory. Very high accuracy measurements were made using diffraction gratings. These were well understood in non-relativistic QM and understood even better in the fully relativistic Quantum Field Theory, Quantum Electrodynamics.
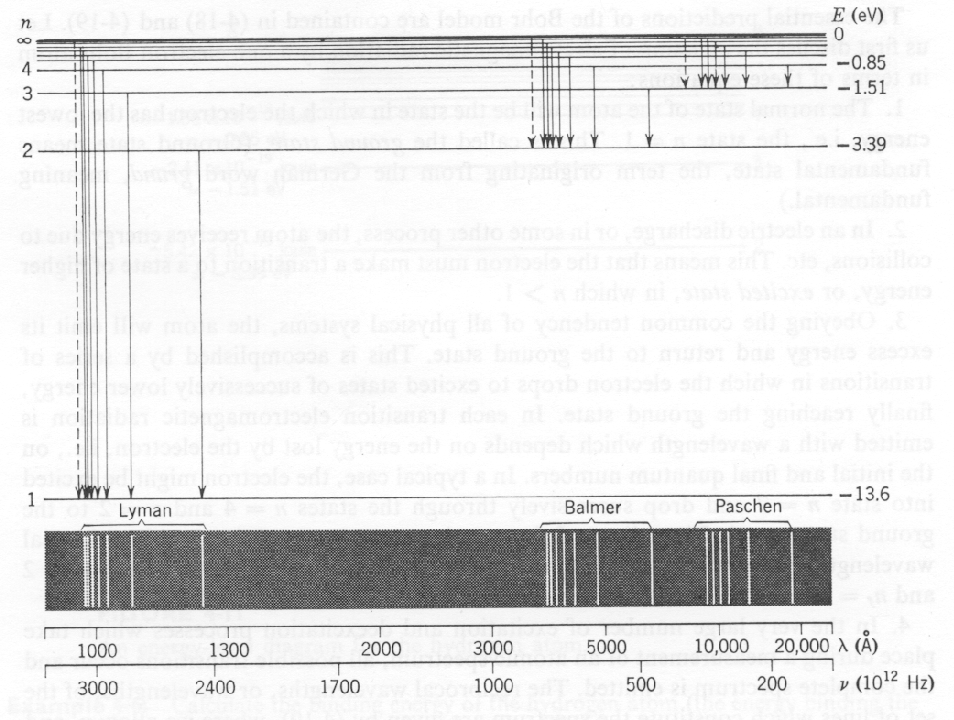
The figure below show the energy levels in Hydrogen, the transitions between energy levels, and the wavelength of light produced in the transition. The Lyman series covers transitions to the ground state and is beyond the visible part of the spectrum. The Balmer series is due to transitions to the first excited state and is in the visible.
By the time of Plank's
![]() ,
a great deal of data existed on the discrete energies at which atoms radiated.
Each atom had its own unique radiation fingerprint.
Absorption at discrete energies had also been observed.
,
a great deal of data existed on the discrete energies at which atoms radiated.
Each atom had its own unique radiation fingerprint.
Absorption at discrete energies had also been observed.
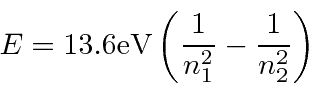
The Rydberg formula for the energies of photons emitted by Hydrogen was developed well
before the QM explanation came along.
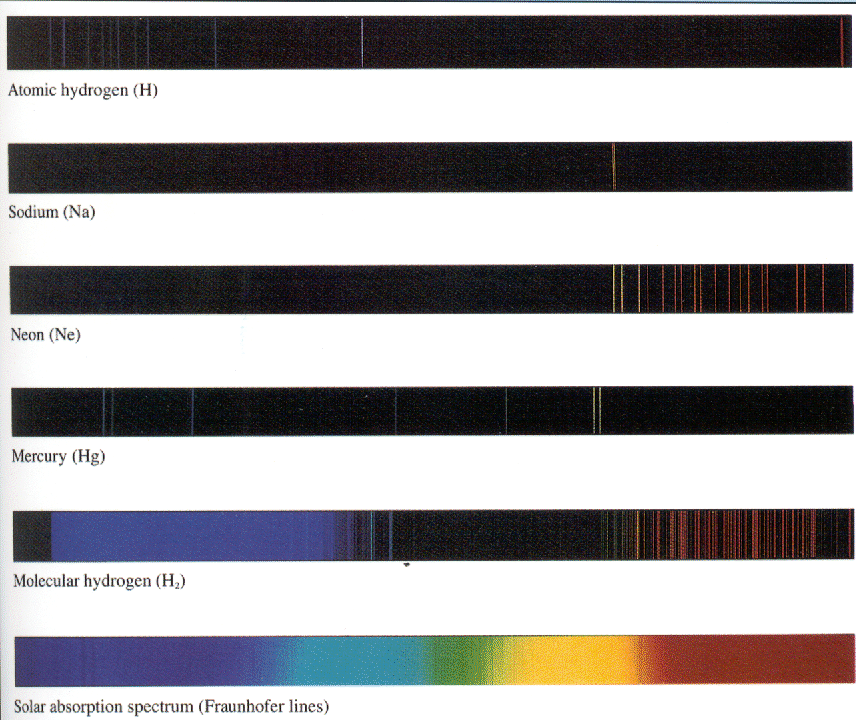
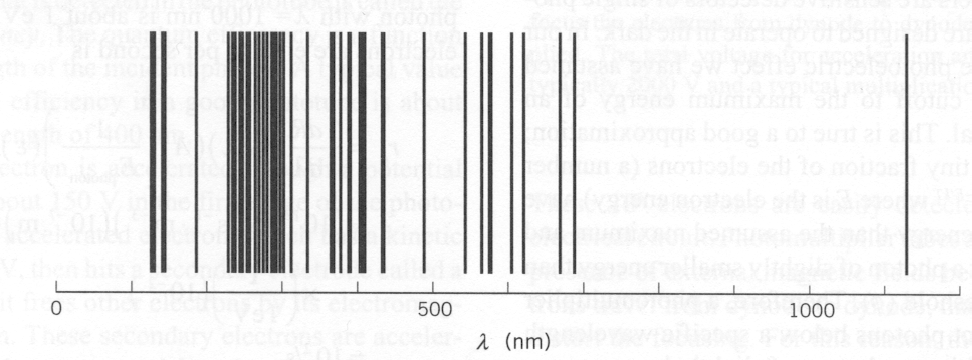
Heavier atoms provide a even richer spectrum but are much more difficult to calculate. Very good approximation techniques have been developed. With computers and good technique, the energy levels of more complex atoms can be calculated. The spectrum of mercury shown below has many more lines than seen in Hydrogen.
The figure below shows the visible part of the spectrum for several atomic or molecular sources. For Hydrogen, we mainly see the Balmer series, with a line from Paschen-Bach. The spectra of different atoms are quite distinct. Molecules have many other types of excitations and can produce many frequencies of light.